
I had a meeting with some SANDSTONE clients last week and they asked me about the inverted yield curve they are reading and hearing about everywhere. I was so glad they asked. And since I’m sure they’re not the only ones wondering what it is and what it means, I thought I’d share my response.
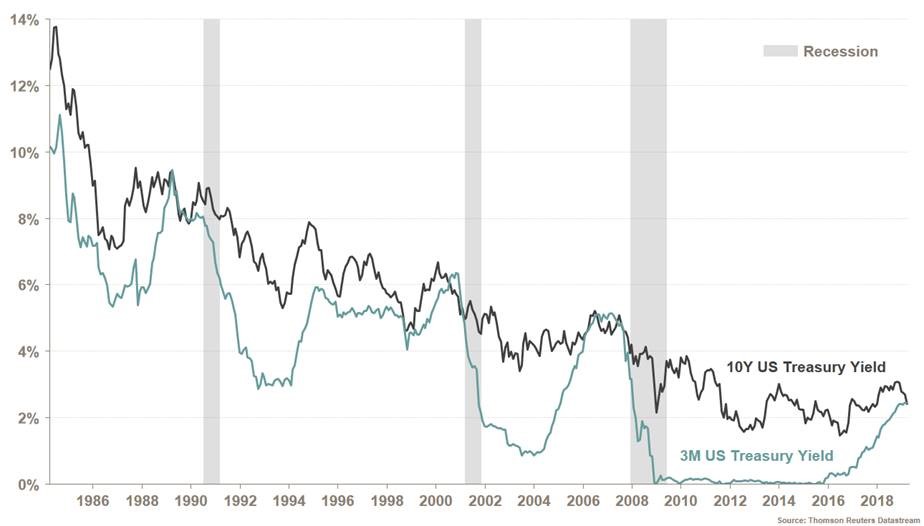
The yield curve — which plots bond yields from shortest maturity to highest — is considered a barometer of economic sentiment. And last month the yield on the US 10-year treasury note dipped below the yield on the 3-month paper for the first time since mid-2007.
Although rare, it is normal that the yield curve would become inverted – especially after the Federal Reserve raised interest rates 5 times over the past couple of years. Shorter-dated bonds are highly sensitive to Federal Reserve policies.
One of the reasons it receives so much publicity is that recessions tend to follow inverted yield curves within a year or so. An inverted curve lowers net margins, discouraging lending. When firms don’t have access to capital, economic growth halts.
How does the inverted yield curve affect investment portfolios?
The truth is, this tends to be most detrimental to banks. Simply put, banks borrow short-term and lend long-term. So, when your borrowing rates are higher than your lending rates – OUCH! So, if you want to know how this is going to affect your portfolio, you must ask yourself – what is your current exposure to North American banks?
If you’re looking for a discretionary wealth management company, take a look at our philosophy to see if SANDSTONE would be a good fit.