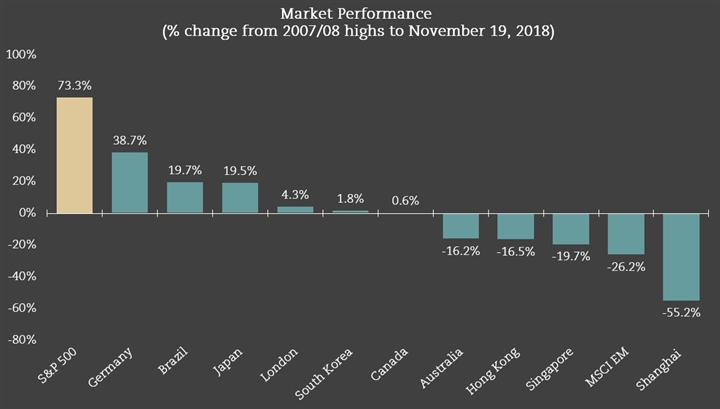
In October we talked about how the US markets highs of 2018 were an anomaly when looked at in relation to world markets. Now we are looking at the performance over the bulk of our current cycle.
Since the bear-market bottom in 2009, the US has endured the longest bull market on record. This entire bull market has been fueled by global synchronized growth and massive liquidity injections created by the loose monetary policies of the word's big-three central banks (US, Europe, Japan). Then, in 2017, the US provided an additional boost to its economy with massive corporate tax cuts and promises of fiscal spending. The S&P 500 alone has advanced ~73% above its pre-bear-market highs in 2007 - outperforming every stock market in the world.

It is interesting to note that many major global equity markets have struggled to surpass their respective 2007 highs. Even with the recent sharp breakdown in the US markets, the performance disparity between the US and the rest of the world remains high.
The growth story in emerging market remains intact at over double the growth rate of developed markets with significantly reduced valuations. The table below illustrates that you are paying on average ~62% more for S&P 500 companies and collecting on average ~31% less in dividend when compared to emerging markets.
|
|
S&P 500 |
MSCI EM |
|---|---|---|
|
Dividend Yield |
2.0% |
2.9% |
|
Price-to-Earnings Ratio |
16.5x |
10.2x |
Generally speaking, anomalies normalize. Whether it is in a week, six months, or a year, at some point the fashionable sector (i.e. US stocks) becomes unfashionable and the out-of-favor sector (i.e. emerging markets) once again finds itself appreciated.
Money flow is shifting. World stock markets are showing rising relative strength versus the S&P 500. China and Emerging Markets are now outperforming. Approximately, US$1.19 billion in capital has flowed into China alone in October - the biggest monthly surge since 2005.
MARKET RELATIVE STRENGTH VS. S&P 500 % CHANGE SINCE SEPT/OCT 2018
|
Market |
% Change |
|---|---|
|
Shanghai Composite |
+9.1 |
|
HK Hang Seng (Oct. 16) |
+8.7 |
|
MSCI Emerging Markets (Oct. 9) |
+6.6 |
|
STOXX Europe 600 (Oct 8) |
+3.9 |
At this late stage in the cycle, pockets of growth do exist but paying the right price for assets remains paramount. It’s what you pay!
