Spotting the Extremes and What They Mean
Extreme movements are easily spotted after they happen, the trick is finding them before they arrive. In the chart below, we see a real-world example of the NASDAQ Tech-bubble extreme - as both an increase and a decline, before returning to its mean, or at least close to it.
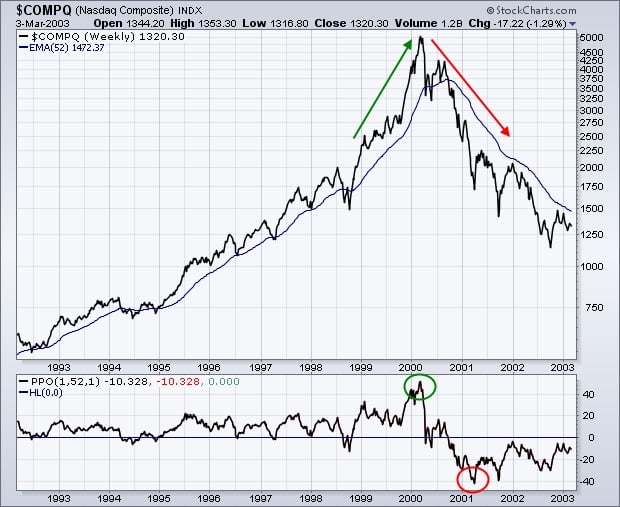
Three stock market rules should be remembered when we see extremes such as this.
- Markets tend to return to the mean over time.
- Trends that get over-extended in one direction or another return to their long-term average. Even during a strong uptrend or strong downtrend, prices often move back (revert) to a long-term moving average.
- Excesses in one direction will lead to an opposite excess in the other direction.
- Markets that overshoot on the upside will also overshoot on the downside, much like a pendulum. The further it swings to one side, the further it rebounds to the other side.
- There are no new eras - excesses are never permanent.
- There will be a hot group of stocks every few years, but speculation fads do not last forever. In fact, over the last 100 years, we have seen speculative bubbles involving various stock groups. Autos, radio, and electricity powered the roaring 20's. The "nifty-fifty" powered the bull market in the early 70's. Bio-techs bubble up every 10 years or so, and there was the dot-com bubble in the late 90's.
“""This time it’s different” is perhaps the most dangerous phrase in investing."”
– Bob Farrell, Retired Merrill Strategist
What is the VIX?
VIX is the ticker symbol for the Chicago Board Options Exchange (CBOE) Volatility Index, which shows the market's expectation of 30-day volatility. It is constructed using the implied volatilities of a wide range of S&P 500 index options. This volatility is meant to be forward-looking and is calculated from both calls and puts. The VIX is widely used to measure market risk, and is often referred to as the "investor fear gauge" or "fear index."
All-Time-Low Interest Rates Snapshot
- 10-year US Treasury bonds now yield 2.4% (Final week of October 2017)
- All four major US stock indexes are trading at, or near, all-time record highs
Investors starving for yield continue piling money into equity markets in search for higher returns than currently offered by the bond market.
What is Happening to Volatility?
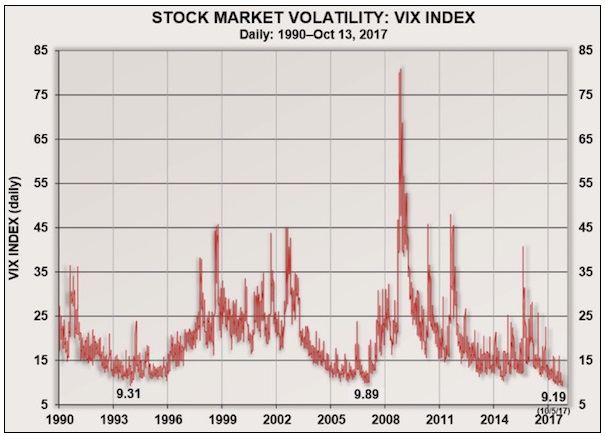
Ed Easterling of Crestmont Research calls attention to the historically low VIX; there have only been 39 times since 1990 when the VIX has closed below 10, and 30 of those times have happened in 2017, with 15 of these below 10 closes happening in the last 30 days! To reference the chart below, notice that the all-time low of 9.19 was put in on October 5, 2017.
Crestmont Research
All previous below 10 closes occur in only two periods. Four of them were in the winter of 1993-94, and the others were in the winter of 2006-07. If you are wondering "why winter?", Christmas is a traditionally light trading period.
It is challenging to create conclusions about the markets next moves. The VIX could spike to 50, or stay in this low range for quite a long time. Essentially, investors have been trained to "buy the dips," and that mentality removes a lot of volatility.
The massive short position in the VIX and VIX futures are shown in its current extreme in the chart below.
Extremes in the VIX
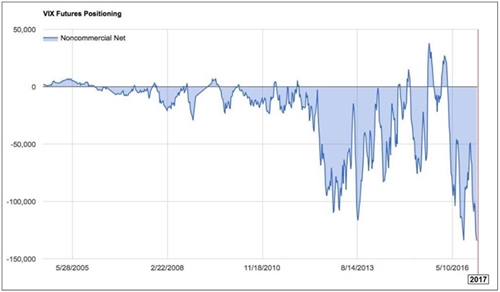
The Felder Report
The VIX is a simple way to measure the future expectations of investors regarding the volatility of market prices. Looking at the chart above, we can see a bull market in complacency.
On this bull market complacency Peter Boockvar of Bloomberg writes:
Bullish stock market sentiments has gotten extreme again, according to Investors Intelligence. Bulls rose 2.9 pts to 60.4 after being below 50 one month ago. Bears sunk to just 15.1 from 17 last week. That's the least amount since May 2015. The spread between the two is the most since March, and - "The bull count re-enters the ‘danger zone' at 60% and higher. That calls for defensive measures." What we've seen this year the last few times bulls got to 60+ was a period of stall and consolidation. When bull/bear spread last peaked in March, stocks chopped around for 2 months. Stocks then resumed its rally when bulls got back around 50. Expect another repeat.
Peter is referencing a historical trend, which there are no new eras and that excesses are never permanent. Every few years there is a group of hot stocks or a bullish upward trend, but speculation fads do not last forever.
““A lesson I learned early is that there is nothing new in Wall Street. There can’t be because speculation is as old as the hills. Whatever happens in the stock market today has happened before and will happen again.””
– Jesse Livermore
Bottom Line
Many market analysts have pointed out that the decline in the VIX does not necessarily imply stock market complacency. Instead, the drop in the index reflects how it tracks the bets of options traders on whether the S&P 500 index will rise or fall.
With this being said, we believe it is important to notice and track these historical changes - especially when they are this extreme.
When stocks are at a record high, bringing the VIX to a record low, we note yet another investment rule: When all the experts and forecasters agree - something else is going to happen. What this means is - when all analysts have a buy rating on stock, there is only one way left to go (downgrade). Excessive bullish sentiment from newsletter writers and analysts should be viewed as a warning sign; Investors should consider buying when strong companies have fallen out of favour. Conversely, investors should consider selling when stocks are the talk of the town, and the news is all positive. Such a contrarian investment strategy usually rewards patient investors.